A LaTeX package for drawing gantt plots using pgf
Introduction
I was searching for a LaTeX package or macros for drawing gantt charts. I found the pst-gantt package but it was nasty using PS Tricks together with pdflatex. So I wrote a small package using pgf/tikz.
Note: The gantt package is also available in the Arch Linux distribution
For package information, look here: https://aur.archlinux.org/packages/texlive-gantt/Note: It seems that the gantt package inspired the development of the CTAN pgfgantt package
The CTAN package can be found here: https://www.ctan.org/pkg/pgfgantt?lang=deUpdate 20.03.2011, Version 1.3
Andrés Silva Marambio (see his BLOG) enhanced the package by adding milestones (\ganttmilestone and \ganttmilestonecon) and a fixed a bug using \ganttbarcon (thanks to Andrés!)Update 15.03.2011, Version 1.2
Some problems of the package has been discussed and identified at tex.stackexchange.com and fixed by Alan Munn. Theese changes are:- px sizes has ben changed ot pt due to problems with some LaTeX distributions (thanks to Michael Kubovy, Loïc Le Guyader)
- Correction of the text aligned in \titleelement (thanks to Josh Hykes!)
- \unitlength was changed to \ganttunitlength
- \RequirePackage was added
Update 05.08.2010, Version 1.1
\ganttbar and \ganttbarcon have been extended with the xkeyval syntaxThe pattern of the bar is now independent of the color and can be set by
e.g. \ganttbar[pattern=horizontal lines,color=blue]{...}{1}{1}
This syntax is now incompatible with the previous ones! Replace \ganttbar[
Old Versions: gantt_v1.0.sty, gantt_v1.1.sty, gantt_v1.2.sty.
Package Description
In the following you will find a short description of environments and commands:
The gantt environment draws the canvas of a gantt figure (realized as tikzpicture)
The usage is \begin{gantt}[...]{no of Tasks to plot}{no of time slots}
The optional argument [...] can be filled in a key=value syntax, using one or more of the following keys:
xunitlength - length of one time slot (default: 1 cm)
fontsize - fontsize of labels (default: \normalsize)
titlefontsize - fontsize of title section (default: \small)
drawledgerline - Switch to enable/disable the drawing of horizontal ledger lines (default value: false)
ganttitle is the environment for drawing the title section
\titleelement draws one element of the title
usage: \titleelement{label}{length}
\numtitle draws a numbered sequence of title elements
usage: \numtitle{start number}{increment}{end number}{length of each title element}
\ganttbar draws a single, unconnected bar for representing a task
usage: \ganttbar[pattern=<pattern>,color=<color>]{label}{start}{length}
where the optional comma separated arguments are:
<pattern> - is a tikz pattern (e.g. north west lines (default), north east lines, crosshatch, crosshatch dots, grid, ...)
<color> - a tikz color of the pattern (e.g. black (default), red, green blue gray, dark gray)
for more information see the tikz documentation
\ganttcon draws an arrow between to bars with specified coordinates
usage: \ganttbar{startx}{starty}{endx}{endy}
\ganttbarcon draws a single bar *and* connects the bar with the previous bar (or milestone) for consecutive tasks
usage: \ganttbar[pattern=<pattern>,color=<color>]{label}{start}{length}
where the optional pattern argument are the same as for \ganttbar
\ganttgroup draws a bar to group tasks
usage: \ganttgroup{label}{start}{length}
\ganttmilestone draws a milestone using a diamond
usage: \ganttmilestone[color=<color>]{label}{start}
where the optional color argument argument is:
<color> - a tikz color of the pattern (e.g. black (default), red, green blue gray, dark gray)
\ganttmilestonecon draws a milestone using a diamond *and* connects the milestone with the previous bar or milestone
usage: \ganttmilestonecon[color=<color>]{label}{start}
where the optional color argument argument is:
<color> - a tikz color of the pattern (e.g. black (default), red, green blue gray, dark gray)
Examples
The usage is best explained by some examples.
Here is a minimal example:
\documentclass{article}
\usepackage{tikz}
\usepackage{gantt}
\begin{document}
\begin{gantt}{10}{12}
\begin{ganttitle}
\numtitle{1}{1}{12}{1}
\end{ganttitle}
\ganttbar{a task}{0}{2}
\ganttbarcon{a consecutive task}{2}{4}
\ganttbarcon{another consecutive task}{8}{2}
\ganttmilestone[color=cyan]{Milestone with color!}{4}
\ganttbar{another task}{2}{2}
\ganttbar[color=cyan]{another coloured task}{4}{4}
\ganttbar{another task}{4}{2}
\ganttcon{4}{5}{4}{7}
\ganttmilestonecon{A connected Milestone}{7}
\ganttbarcon{another consecutive task}{8}{2}
\end{gantt}
\end{document}
leading to the result:
Here is a similar example using the names of the month's:
...
\begin{gantt}{7}{12}
\begin{ganttitle}
\titleelement{Jan}{1}
\titleelement{Feb}{1}
\titleelement{Mar}{1}
\titleelement{Apr}{1}
\titleelement{May}{1}
\titleelement{Jun}{1}
\titleelement{Jul}{1}
\titleelement{Aug}{1}
\titleelement{Sep}{1}
\titleelement{Oct}{1}
\titleelement{Nov}{1}
\titleelement{Dec}{1}
\end{ganttitle}
\ganttbar{Task 1}{0}{2}
\ganttbarcon{a consecutive task}{2}{4}
\end{gantt}
...
leading to the result:
You can use more titles with diffent length' to divide the time axis:
...
\begin{gantt}{7}{12}
\begin{ganttitle}
\numtitle{2010}{1}{2012}{4}
\end{ganttitle}
\begin{ganttitle}
\numtitle{1}{1}{4}{1}
\numtitle{1}{1}{4}{1}
\numtitle{1}{1}{4}{1}
\end{ganttitle}
\ganttbar{Task 1}{0}{2}
\ganttbarcon{a consecutive task}{2}{4}
\end{gantt}
...
leading to the result:
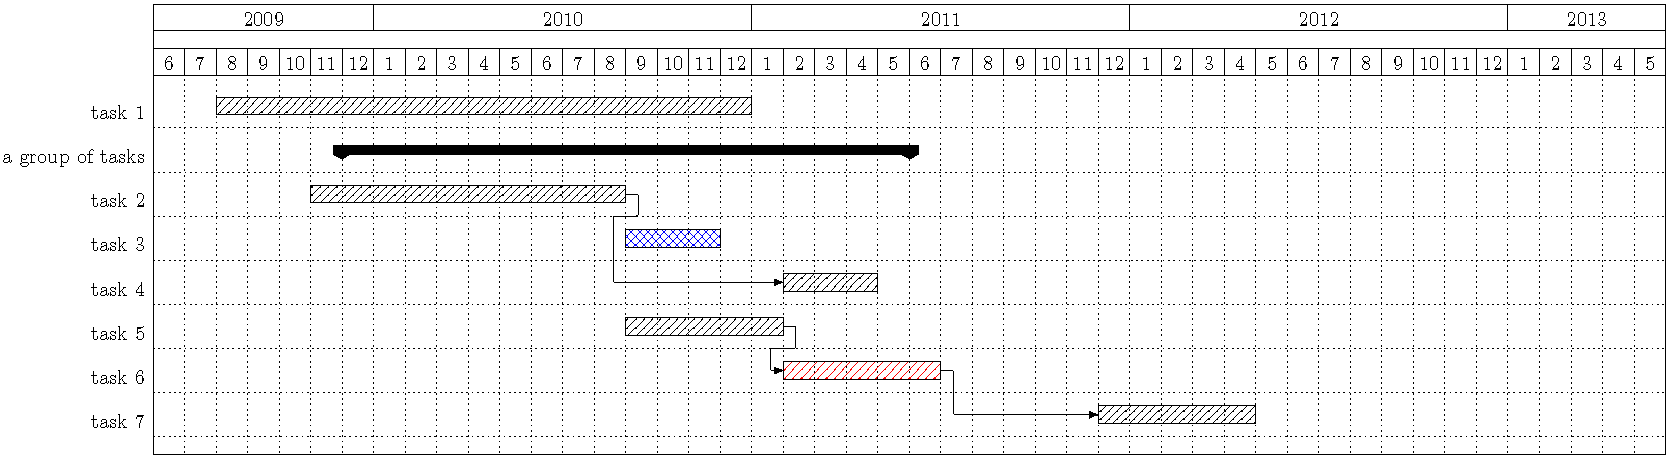
Here is a more complex example using groups, different patterns and the optional arguments:
\documentclass{article}
\usepackage{gantt}
\usepackage{pdflscape}
\begin{document}
\begin{landscape}
\scalebox{0.8}{
\begin{gantt}[xunitlength=0.5cm,fontsize=\small,titlefontsize=\small,drawledgerline=true]{10}{48}
\begin{ganttitle}
\titleelement{2009}{7}
\numtitle{2010}{1}{2012}{12}
\titleelement{2013}{5}
\end{ganttitle}
\begin{ganttitle}
\numtitle{6}{1}{12}{1}
\numtitle{1}{1}{12}{1}
\numtitle{1}{1}{12}{1}
\numtitle{1}{1}{12}{1}
\numtitle{1}{1}{5}{1}
\end{ganttitle}
\ganttbar{task 1}{2}{17}
\ganttgroup{a group of tasks}{6}{18}
\ganttbar{task 2}{5}{10}
\ganttbar[pattern=crosshatch,color=blue]{task 3}{15}{3}
\ganttbar{task 4}{20}{3}
\ganttcon{15}{4}{20}{6}
\ganttbar{task 5}{15}{5}
\ganttbarcon[color=red]{task 6}{20}{5}
\ganttbarcon{task 7}{30}{5}
\end{gantt}
}
\end{landscape}
\end{document}
leading to the result: